Hipstr-tutorial
Running HipSTR on human WGS data
This project is maintained by HipSTR-Tool
HipSTR-tutorial
Simple tutorial demonstrating how to run HipSTR with human WGS data and interpret the output
Introduction
In this tutorial, we'll be genotyping 599 STRs that are part of the Marshfield panel of markers. These markers are some of the most polymorphic STRs in the human genome. We'll be using whole-genome sequencing data for NA12878, NA12891 and NA12892, a trio of individuals that is widely analyzed in genomics.
Getting setup
First, download this repository and all of its files from github
git clone https://github.com/HipSTR-Tool/HipSTR-tutorial.git
cd HipSTR-tutorial
Next, let's download HipSTR from github and build it:
git clone https://github.com/tfwillems/HipSTR.git
cd HipSTR
make
cd ../
The last source of input we'll need are FASTA files for the human genome. Since our BAM alignments are relative to the hg19 reference genome, we'll download the sequences for its chromosomes. HipSTR requires a single FASTA file, so we concatenate each chromosome into a single file and index it using samtools:
mkdir fasta
cd fasta
wget http://hgdownload.cse.ucsc.edu/goldenPath/hg19/bigZips/chromFa.tar.gz
tar -xzvf chromFa.tar.gz
cat chr*.fa > all_chroms.fa
samtools faidx all_chroms.fa
cd ../
Input files
In the tutorial directory, we've provided a regions.bed file that contains the required information about each STR. Each line in the BED file contains the chromosomal positions of an STR, its period, the number of repeat copies and it's name:
head -n 5 regions.bed
chr1    6464771 6464818 4   12  MFD424-TTTA003
chr1    7142501 7142552 4   13  GATA23G09
chr1    10987588    10987617    3   10  AAT238
chr1    13784267    13784306    4   10  GATA27E01
chr1    16540224    16540267    4   11  TTTA063
We've also provided sorted and indexed BAM files in bams/ that were prefiltered to save space. These files only contain reads and their mate pairs that overlap the STRs we're interested in.
Let's take a look at the sample information in these BAMs:
for file in bams/*.bam; do samtools view -H $file | grep @RG; done
@RG ID:ERR194147    LB:ERR194147    PL:Illumina SM:NA12878  PU:ERR194147
@RG ID:ERR194160    LB:ERR194160    PL:Illumina SM:NA12891  PU:ERR194160
@RG ID:ERR194161    LB:ERR194161    PL:Illumina SM:NA12892  PU:ERR194161
@RG ID:SRR826427    LB:SRR826427    PL:Illumina SM:NA12891  PU:SRR826427
@RG ID:SRR826428    LB:SRR826428    PL:Illumina SM:NA12892  PU:SRR826428
@RG ID:SRR826448    LB:SRR826448    PL:Illumina SM:NA12891  PU:SRR826448
@RG ID:SRR826463    LB:SRR826463    PL:Illumina SM:NA12878  PU:SRR826463
@RG ID:SRR826465    LB:SRR826465    PL:Illumina SM:NA12891  PU:SRR826465
@RG ID:SRR826467    LB:SRR826467    PL:Illumina SM:NA12878  PU:SRR826467
@RG ID:SRR826469    LB:SRR826469    PL:Illumina SM:NA12878  PU:SRR826469
@RG ID:SRR826471    LB:SRR826471    PL:Illumina SM:NA12892  PU:SRR826471
@RG ID:SRR826473    LB:SRR826473    PL:Illumina SM:NA12892  PU:SRR826473
Each of the 12 BAM files has a single read group, corresponding to 1 of 3 samples: NA12878, NA12891 or NA12892. HipSTR uses the SM tags to determine what sample each read comes from and uses the LB tag to determine what sequencing library each read comes from.
Running HipSTR
Now that we have the required input files, let's run HipSTR. We can analyze all of the BAMs jointly to genotype all 3 samples at the 599 STRs as follows:
./HipSTR/HipSTR --bams      bams/ERR194147.bam,bams/ERR194160.bam,bams/ERR194161.bam,bams/SRR826427.bam,bams/SRR826428.bam,bams/SRR826448.bam,bams/SRR826463.bam,bams/SRR826465.bam,bams/SRR826467.bam,bams/SRR826469.bam,bams/SRR826471.bam,bams/SRR826473.bam
                --fasta     fasta/all_chroms.fa
                --regions   regions.bed
                --str-vcf   trio.marshfield.vcf.gz
                --log       trio.marshfield.log
                --viz-out   trio.marshfield.viz.gz
                --min-reads 25 --def-stutter-model
This will generate a bgzipped VCF file (trio.marshfield.vcf.gz) containing STR genotypes, as well as a compressed file (trio.marshfield.viz.gz) we'll later use to visualize the results. On a standard CPU, this should take 2-3 minutes to run. We've opted to use the --def-stutter-model option as three samples is too few to accurately infer stutter models.
Interpreting HipSTR's output
To help understand HipSTR's output, lets examine the VCF information for the STR named GATA27E01. If you recall from above, GATA27E01 has the following information in our region file:
chr1 13784267 13784306 4 10 GATA27E01
We'll use VCFTools to extract the information for this STR from our VCF file and we'll then use datamash to convert each column into its own line:
vcftools --gzvcf trio.marshfield.vcf.gz --snp GATA27E01 --recode --recode-INFO-all --stdout | tail -n 2 | datamash transpose
This produces output that looks something like the following:
#CHROM  chr1
POS 13784267
ID  GATA27E01
REF GATAGATAGATAGATAGATAGATAGATAGATAGATAGATA
ALT GATAGATAGATAGATAGATAGATAGATA,GATAGATAGATAGATAGATAGATAGATAGATA,GATAGATAGATAGATAGATAGATAGATAGATAGATAGATAGATA
QUAL    .
FILTER  .
INFO    INFRAME_PGEOM=0.950;INFRAME_UP=0.050;INFRAME_DOWN=0.050;OUTFRAME_PGEOM=0.950;OUTFRAME_UP=0.010;OUTFRAME_DOWN=0.010;START=13784267;END=13784306;PERIOD=4;NSKIP=0;NFILT=0;BPDIFFS=-12,-8,4;DP=230;DSNP=0;DFILT=0;DSTUTTER=1;DFLANKINDEL=1;AN=6;REFAC=1;AC=1,2,2
FORMAT  GT:GB:Q:PQ:DP:DSNP:DFILT:DSTUTTER:DFLANKINDEL:PDP:PSNP:BPDOSE:GLDIFF:BQ:ALLREADS:MALLREADS
NA12878 2|3:-8|4:1.000:0.500:84:0:0:0:0:41.000|43.000:0|0:-4.000:52.318:1.000:-999|14;-8|31;4|39:-8|37;4|39
NA12891 0|3:0|4:1.000:0.500:64:0:0:1:1:30.426|33.574:0|0:4.000:21.905:1.000:-999|9;0|28;4|27:0|27;4|27;8|1
NA12892 1|2:-12|-8:1.000:0.500:82:0:0:0:0:40.039|41.961:0|0:-20.000:27.724:1.000:-999|9;-12|34;-8|39:-12|38;-8|41
What does this tell us?
- HipSTR detected 3 additional present alleles (ALT) that are -12, -8 and +4 bp in length relative to the ref allele (INFO:BPDIFFS).
- The genotype (GT) for NA12891 suggests that he carries the ref allele and a 4 bp insertion, with high confidence (Q=1.0=100% posterior)
- The genotype (GT) for NA12892 suggests that she carries a 12 bp deletion and an 8 bp deletion, with high confidence (Q=1.0)
- The genotype (GT) for NA12878 suggests that she carries an 8 bp deletion and a 4 bp insertion, with high confidence (Q=1.0)
- None of the genotypes are phased (PQ=0.5) because HipSTR was not run with the --snp-vcf option and no samples have phase-informative reads (DSNP=0)
- There are very few reads with stutter artifacts (DSTUTTER = 0, 1, and 0 for NA12878, NA12891 and NA12892)
- There are very few reads with indels in the flanking sequences (DFLANKINDEL = 0, 1, and 0 for NA12878, NA12891 and NA12892)
- The high posterior confidences (Q), combined with the low stutter and flanking indel frequencies, make us very confident in the reported genotypes!
This is great, but what is HipSTR doing under the hood? And how can we visualize these results to gain confidence?
Below, we'll use the output from the --viz-out HipSTR option (trio.marshfield.viz.gz) and a tool provided in the HipSTR directory called VizAlnPdf. This tool analyzes the compressed visualization file to generate PDFs of HipSTR's maximum-likelihood (ML) alignments. These ML alignments indicate the arrangement of all of a sample's reads relative to its ML genotype. Before we can do so, we need to index the compressed file using tabix:
tabix -p vcf trio.marshfield.viz.gz
NA12891
Visualizing the maximum likelihood alignments for NA12891 is easy:
HipSTR/VizAlnPdf trio.marshfield.viz.gz chr1 13784267 NA12891 viz_NA12891 3
This will generate a PDF file viz_NA12891.pdf containing maximum likelihood alignments for every 3rd read.
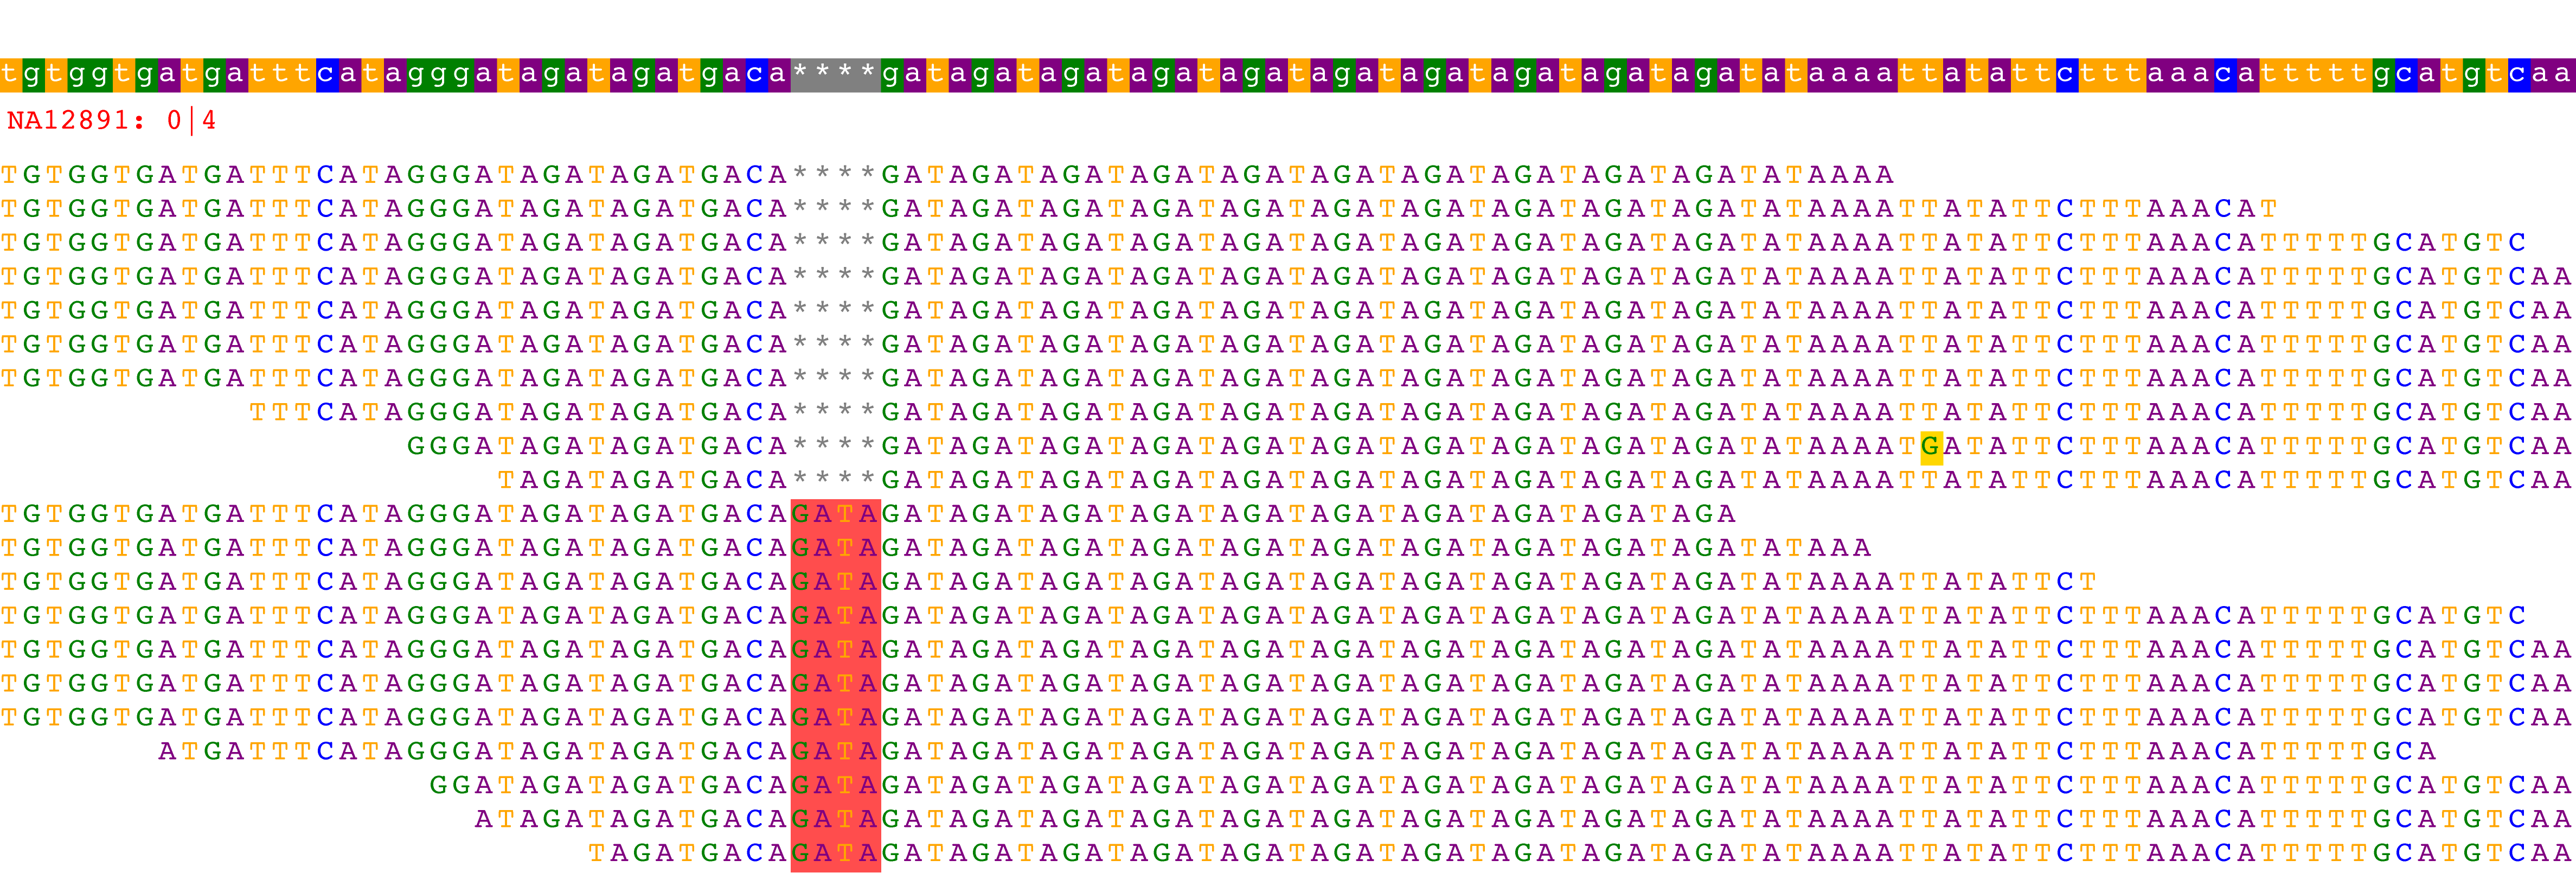 The first group of reads provides strong support for the reference allele in this sample. The second group of reads, which contain insertions highlighted in red, stronly support the +4 bp allele. Internally, HipSTR disentangles which read belongs to each haplotype as is diplayed in the PDF.
NA12892
Viewing the alignments for NA12892 is just as easy:
HipSTR/VizAlnPdf trio.marshfield.viz.gz chr1 13784267 NA12892 viz_NA12892 3
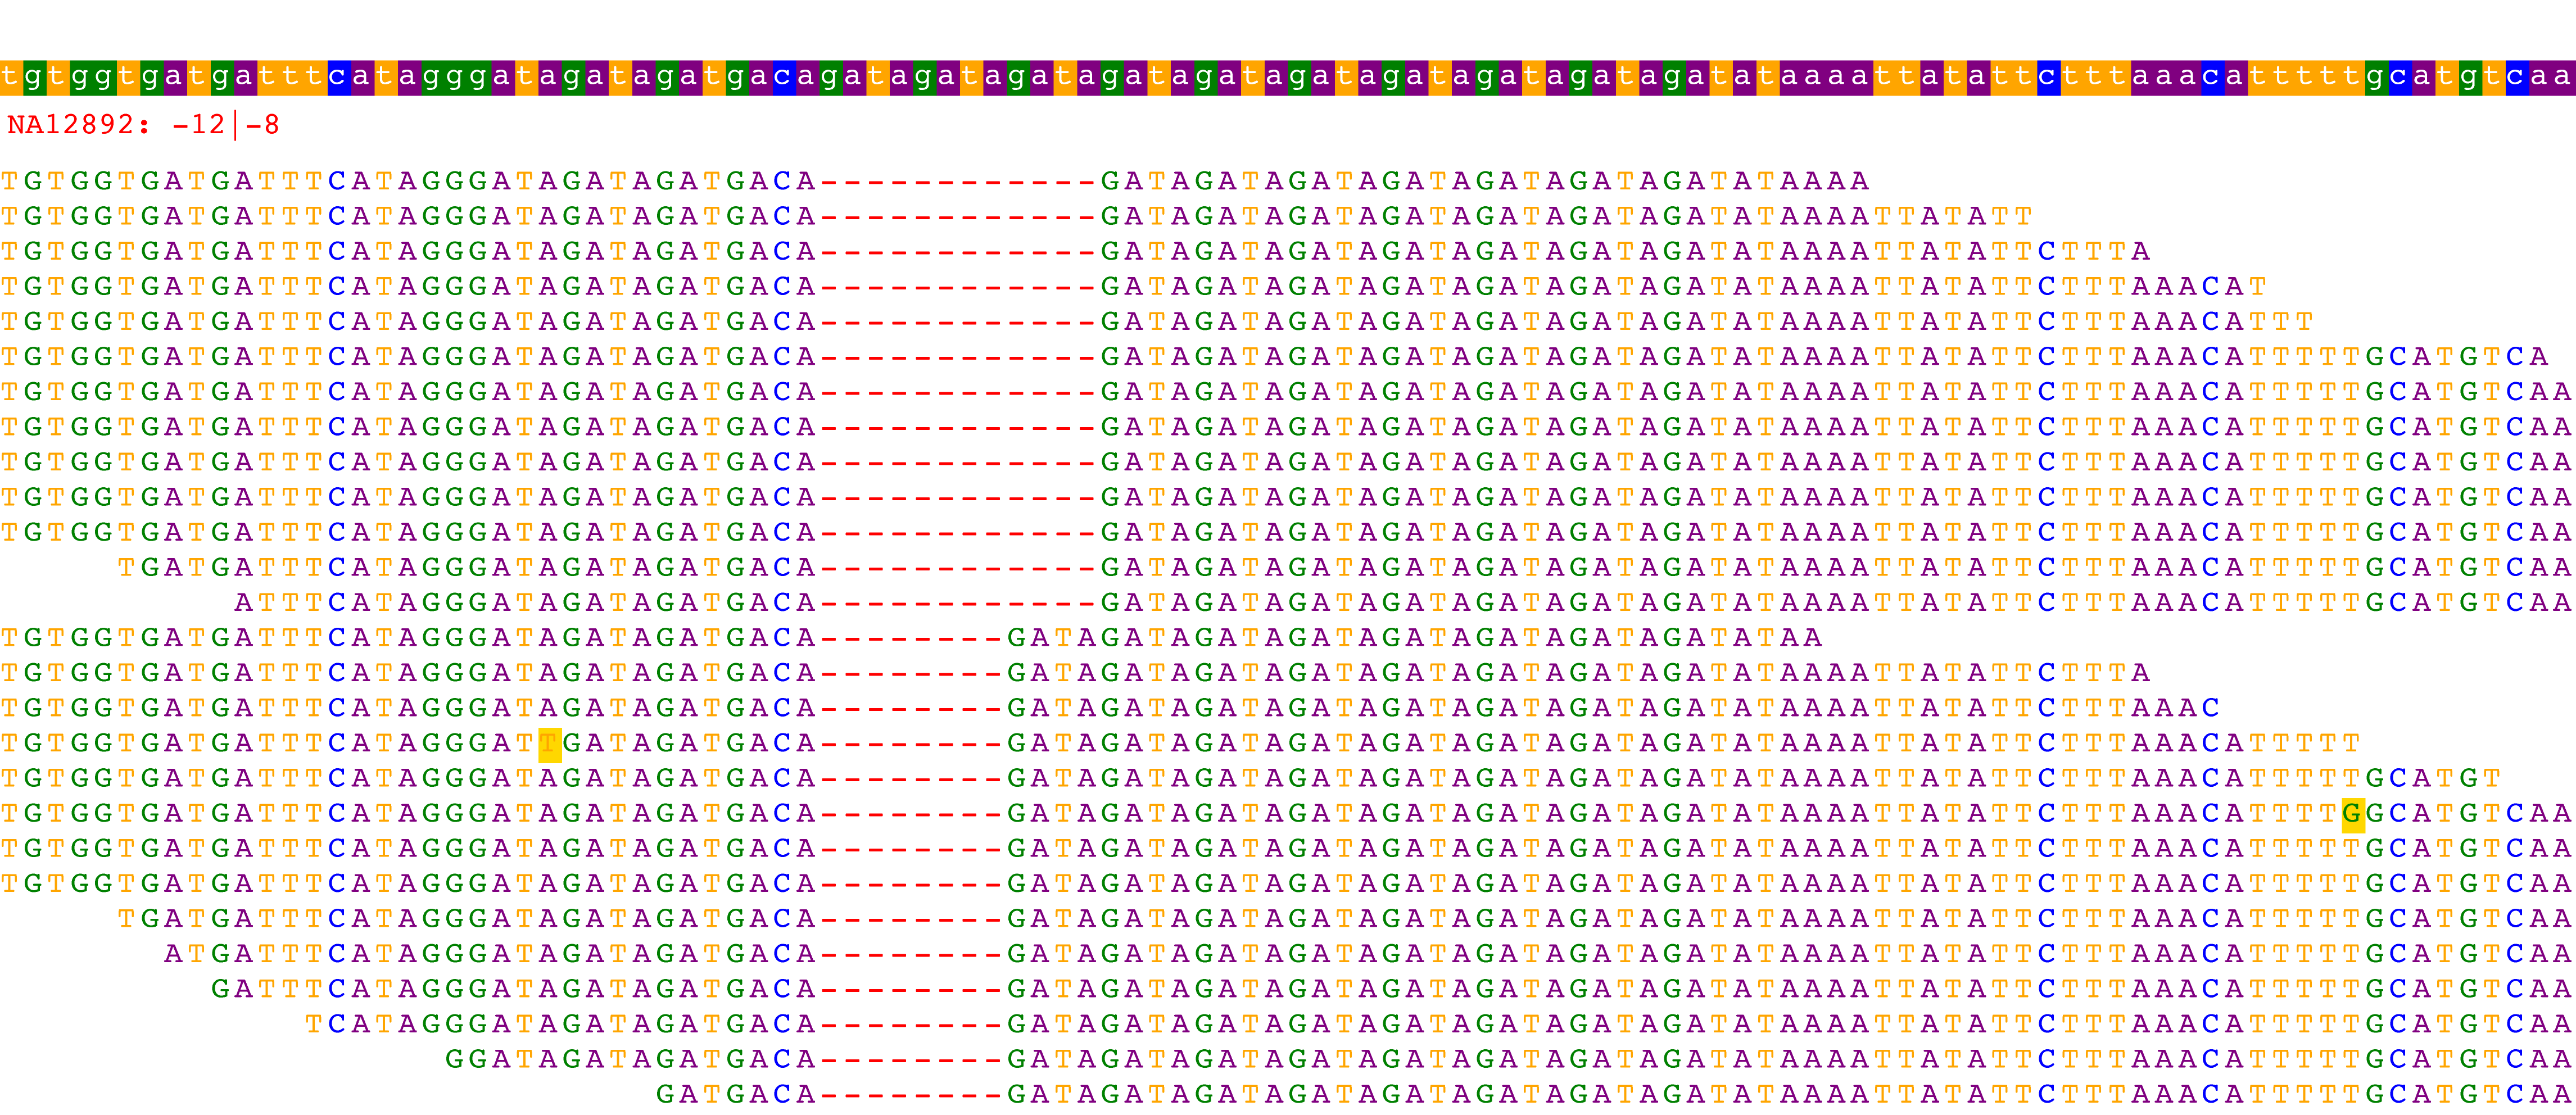 We again see that the reads strongly support the -12/-8 genotype determined for this sample
NA12878
Lastly, we can visualize NA12878's maximum likelihood alignments:
HipSTR/VizAlnPdf trio.marshfield.viz.gz chr1 13784267 NA12878 viz_NA12878 3
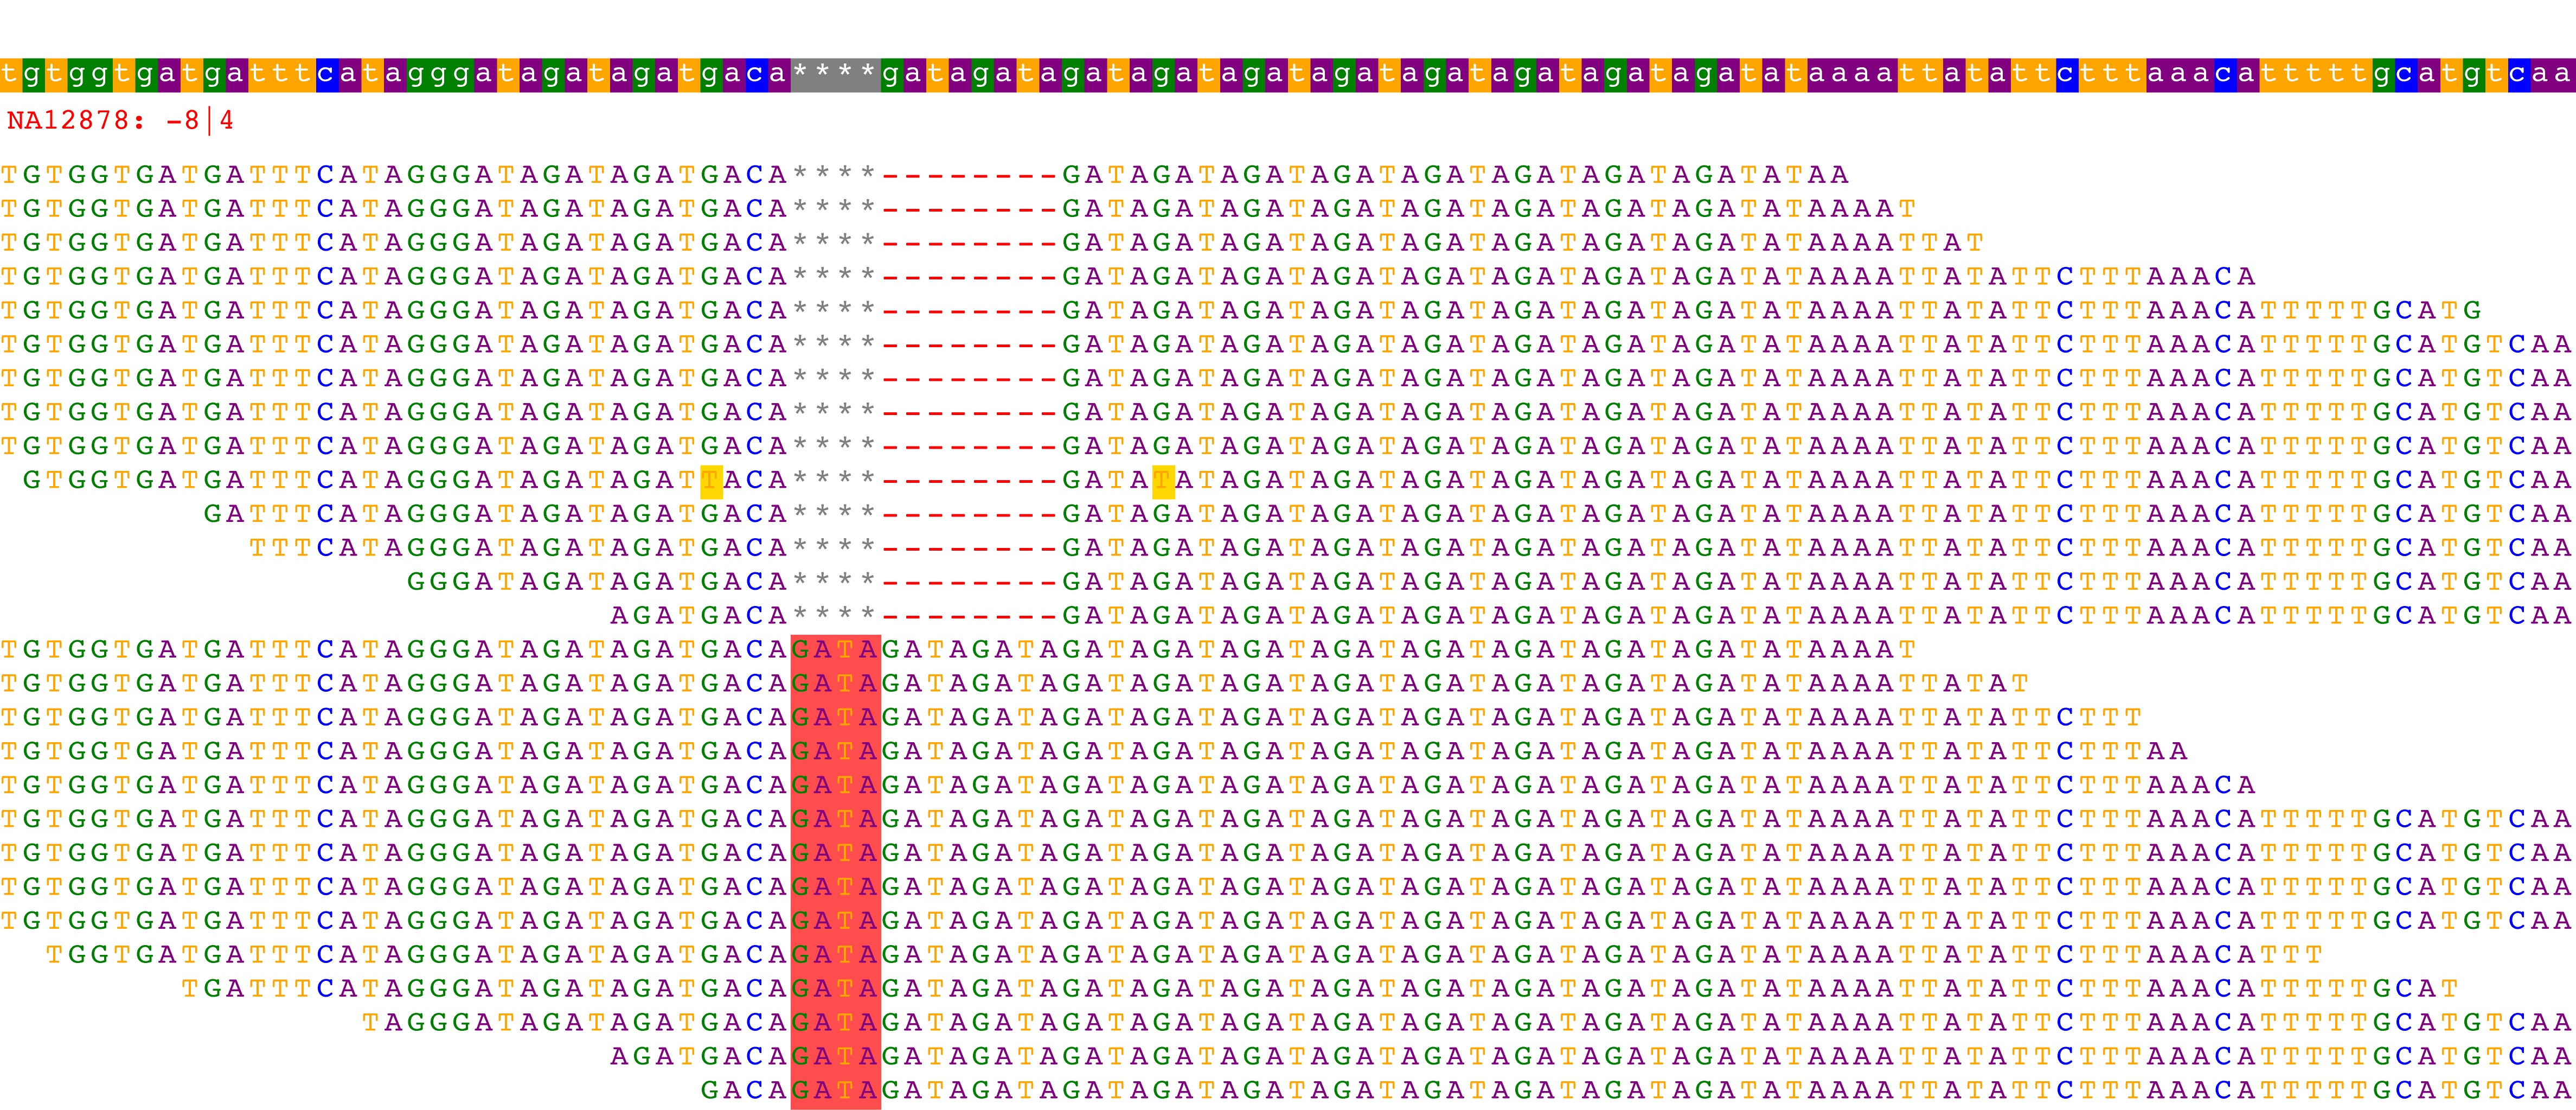 The first group of reads support the -8bp allele, while the second groups supports the +4bp allele.
In summary, VizAlnPdf provides a powerful way to interpret HipSTR's output and gain confidence in corresponding genotypes.
Conclusion
This tutorial provided a brief overview of how to run HipSTR on a simple dataset and interpret the results. For more information, please refer to the main HipSTR page or send questions or issues to hipstrtool@gmail.com